← all work
(04)Index Builder MSCI · 2021

Build an index around any personalized goal.

A backtesting and data visualization tool that lets asset managers build custom indexes and see how they would have performed over time.

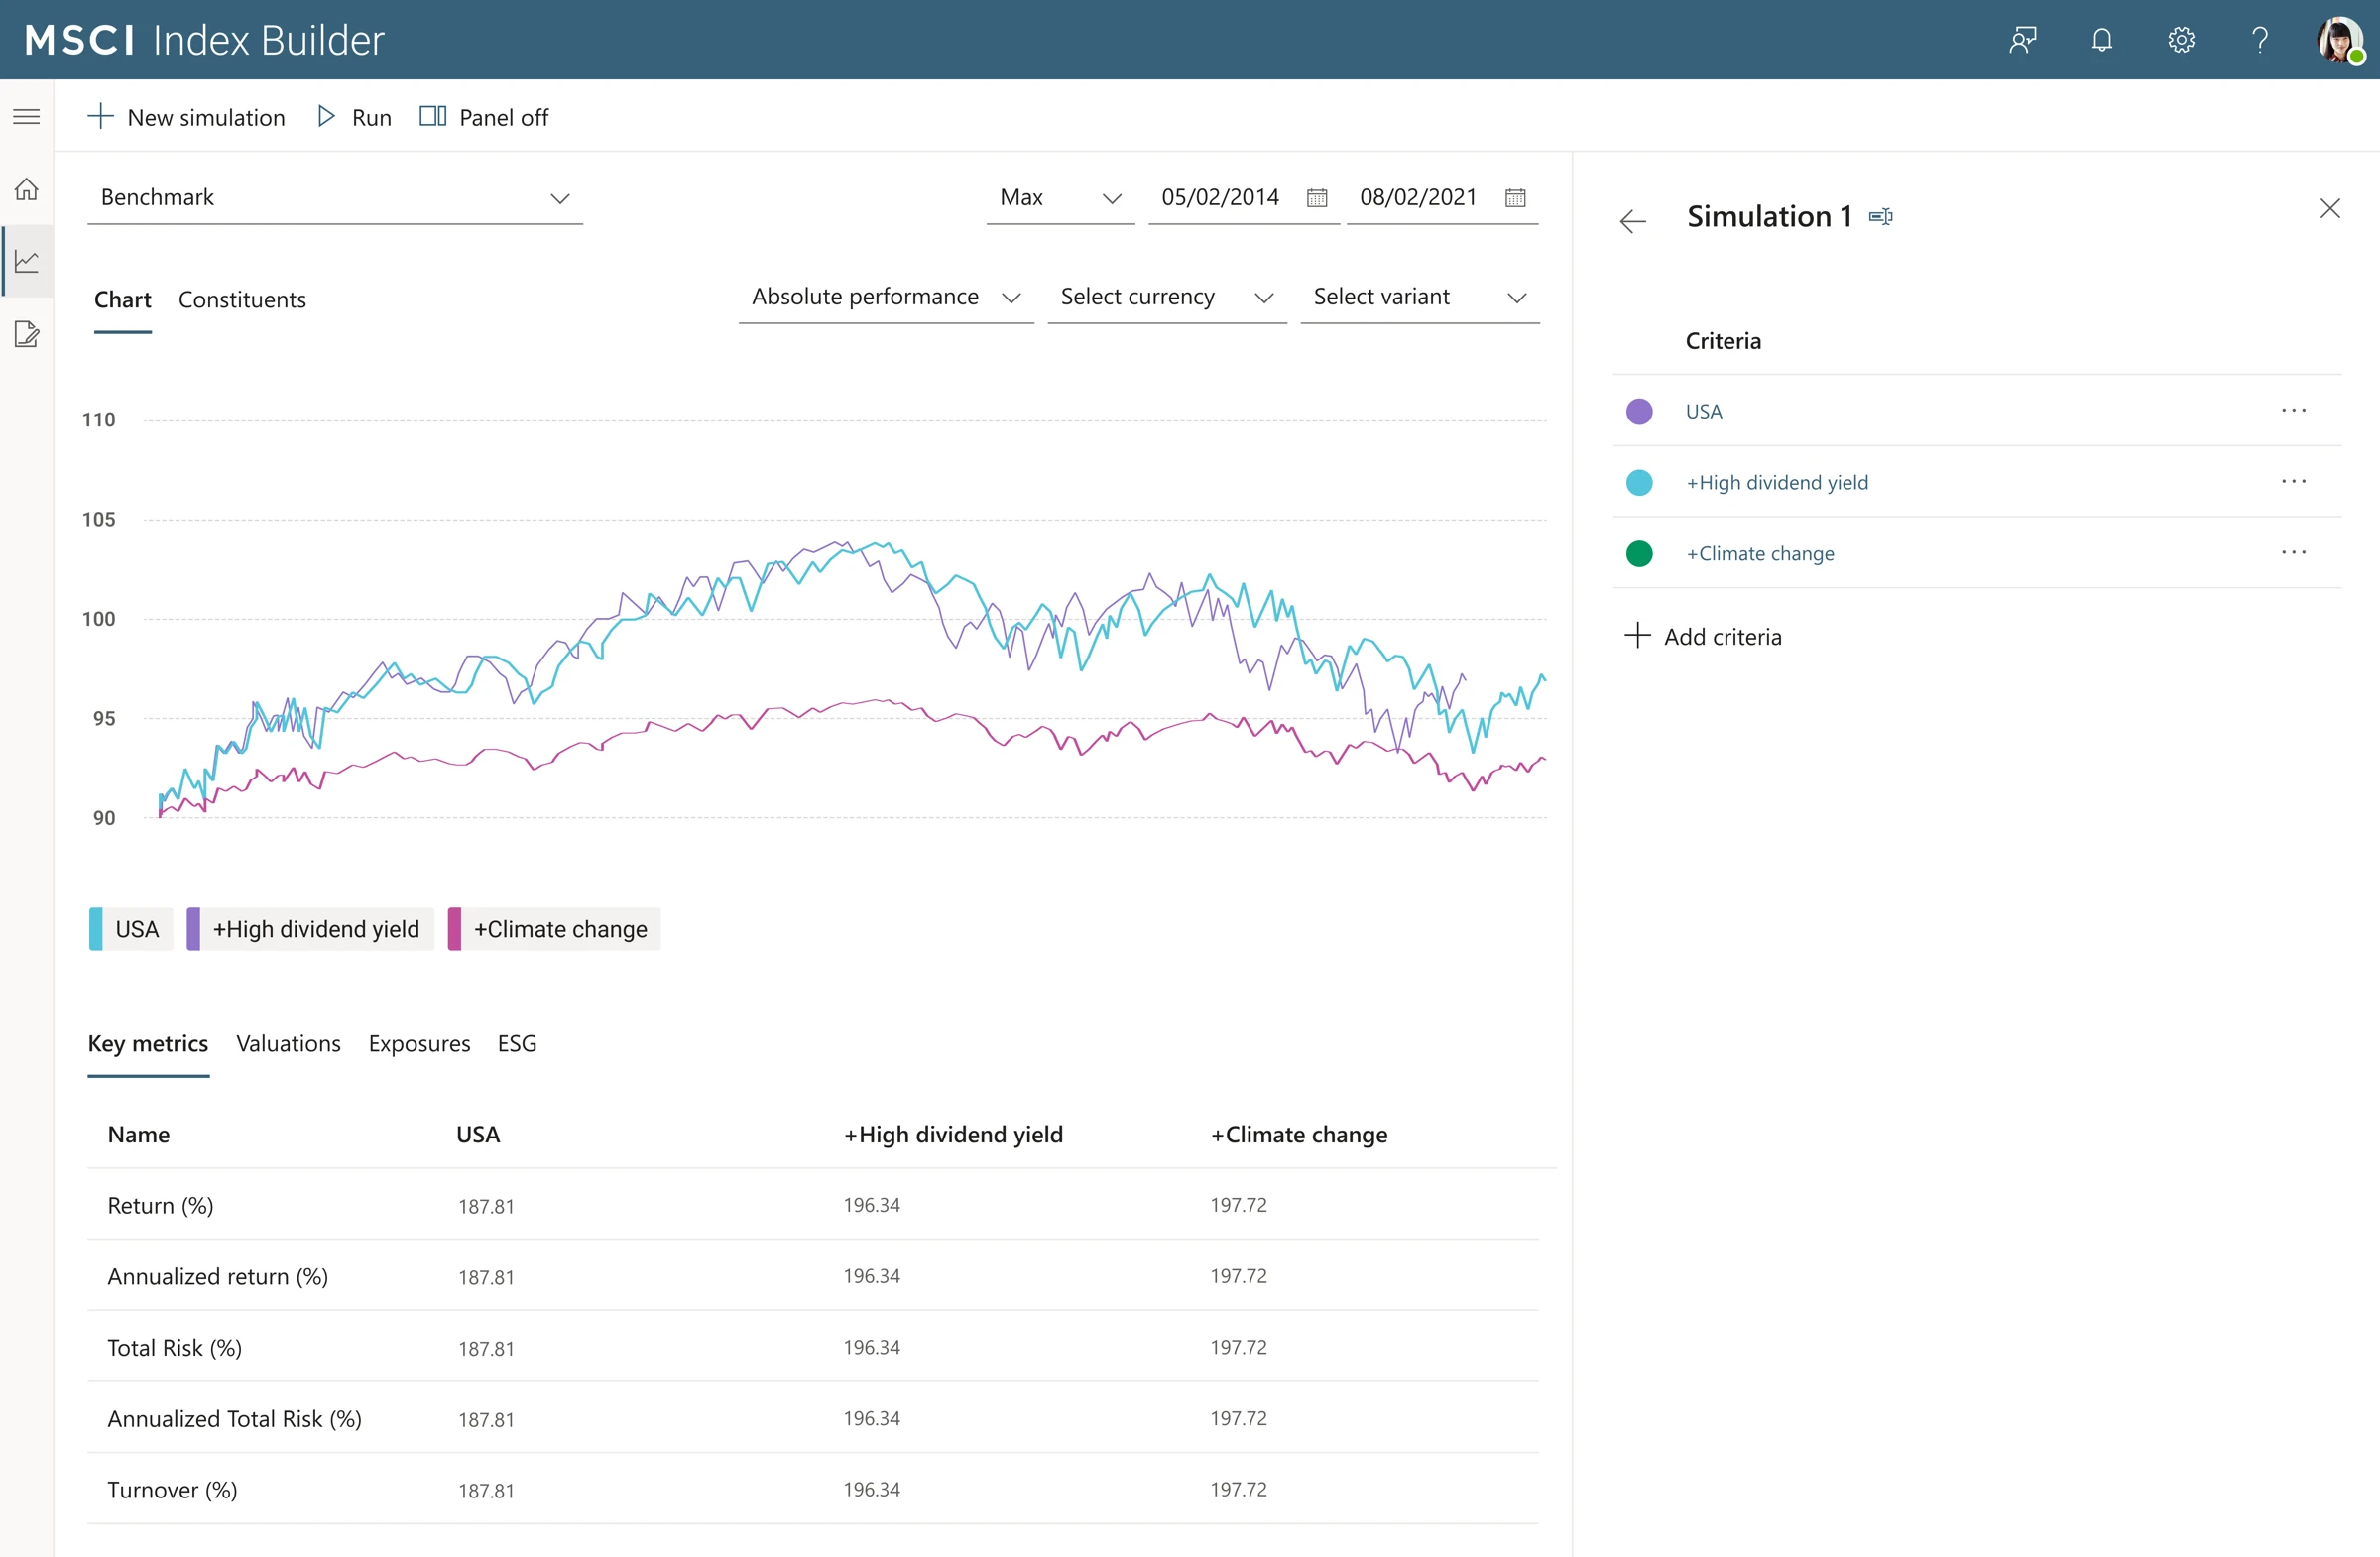
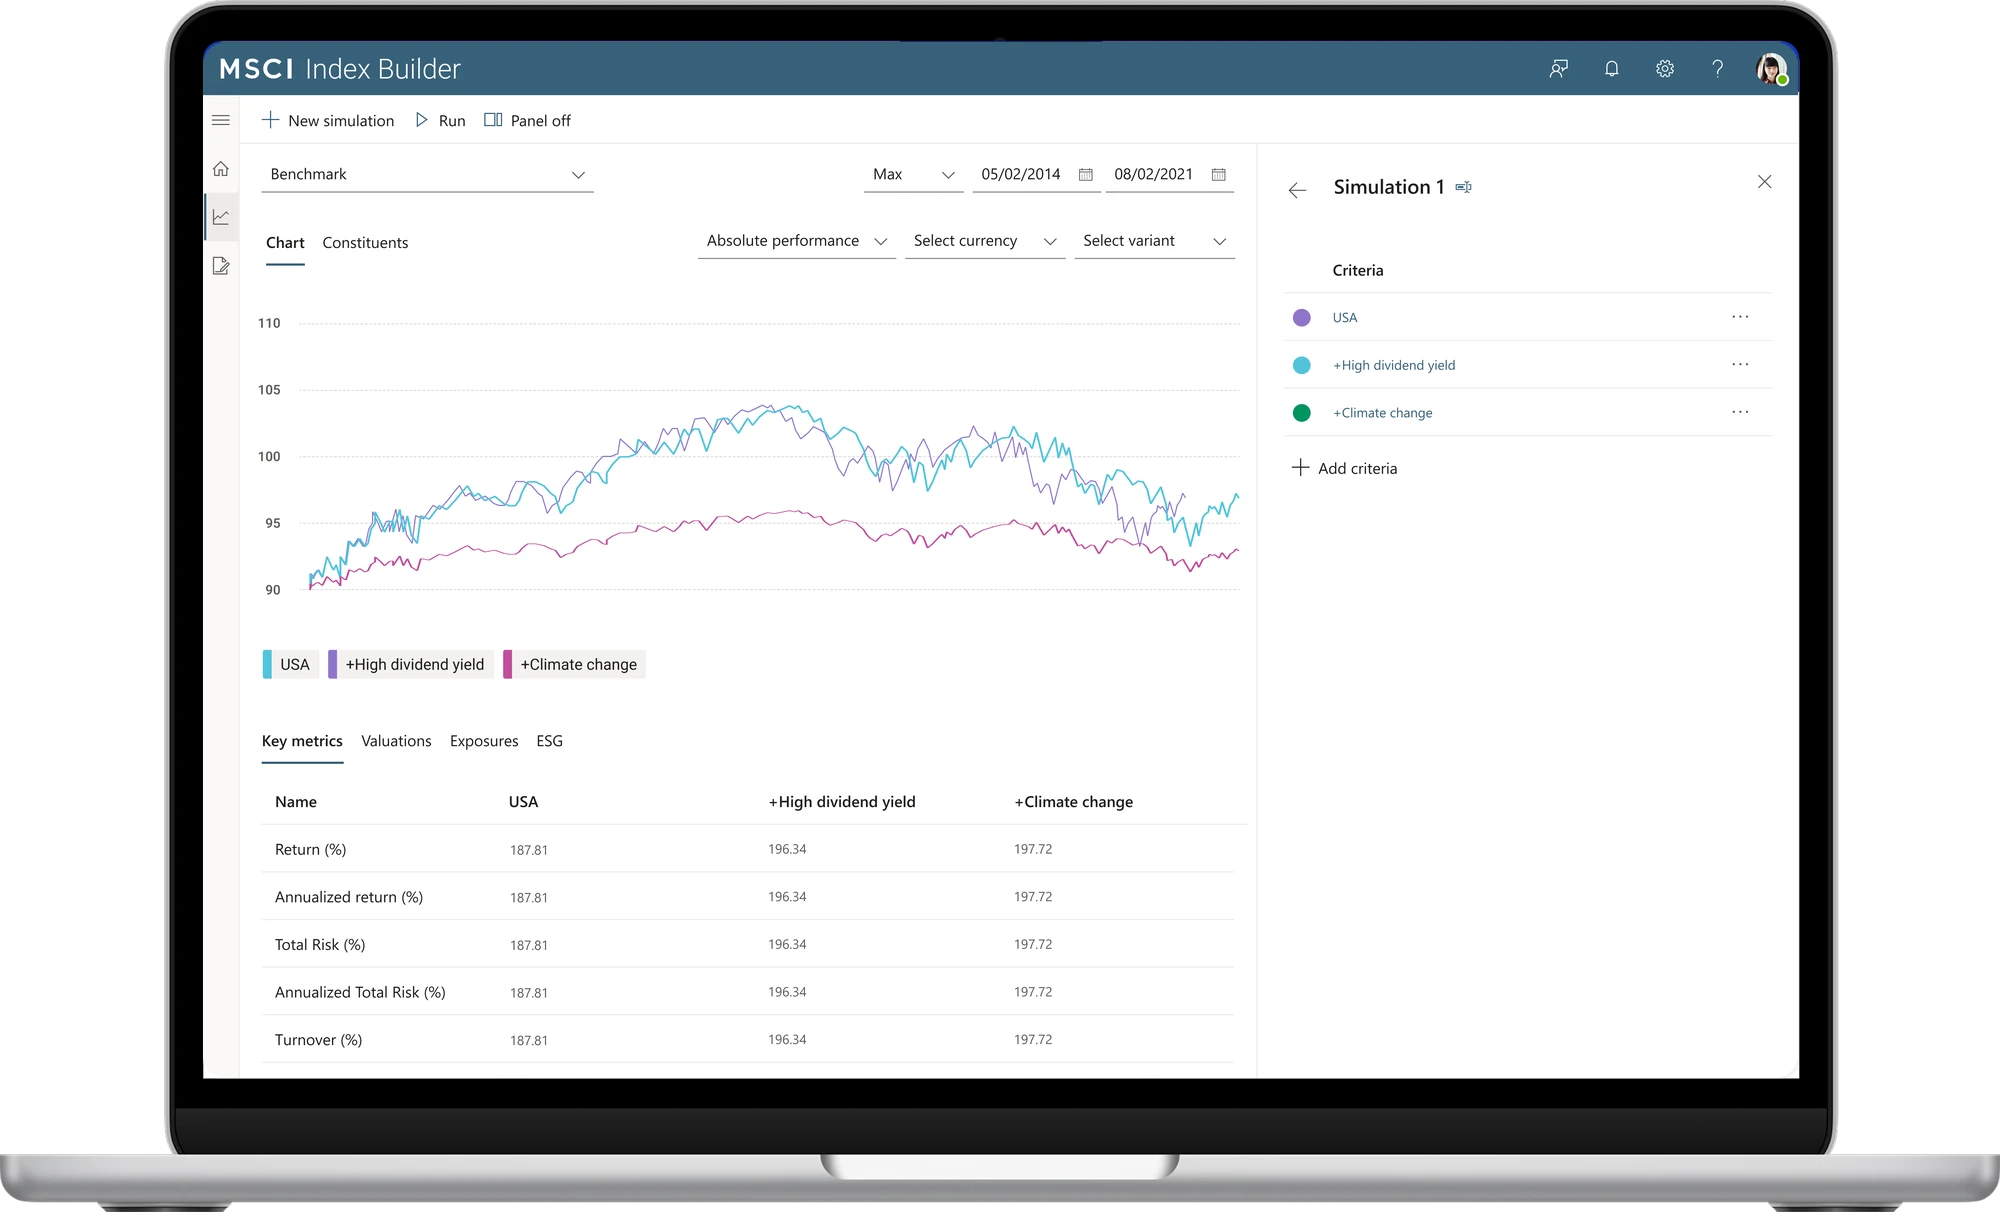
Laptop showing an Index Builder simulation: a benchmark chart comparing USA, high dividend yield and climate change criteria, with key metrics below and the criteria panel on the right
(role)
Product Design Lead
(team)
Product design, product management, engineering
(timeline)
Aug – Dec 2021
Launched
(tools)
Figma
UserTesting

(the problem)

Asset managers build indexes to fit investment goals, regulatory requirements or client preferences. Before committing to one, they need to see how it would have performed, and trust what they're seeing.

(the solution)

A flexible builder for choosing asset classes, regions and strategies, then backtesting the result against a benchmark, with the chart and key metrics side by side.

(my role)

I led product design and research with product management and engineering, from concept to launch in December 2021, and validated the experience through user testing.

the final design

Build, backtest and compare in one simulation, so an idea becomes an index in a few steps.

(01) Build

Layer on criteria, one at a time

Start from a market, then browse criteria by category, from capping and climate to ESG, factor, screening and weighting. Pick one, like a high dividend yield, and fine-tune its screens and rebalancing before applying it.
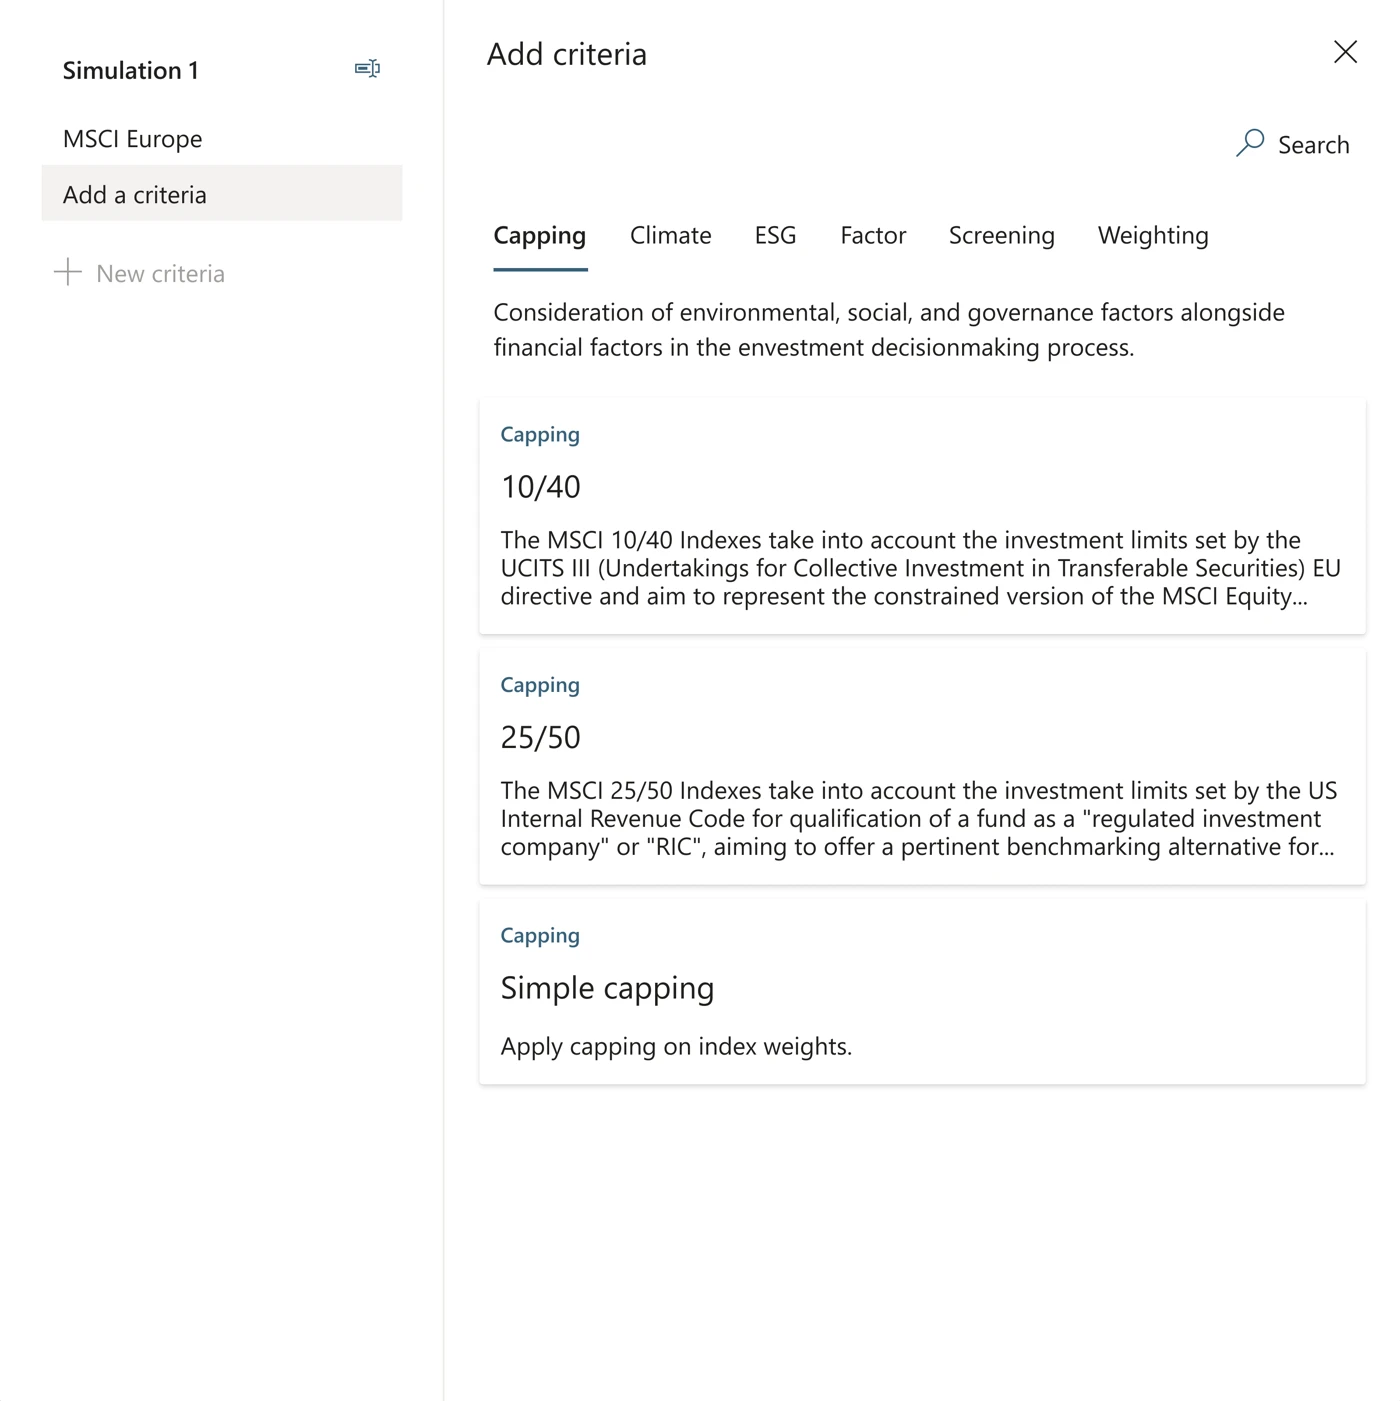
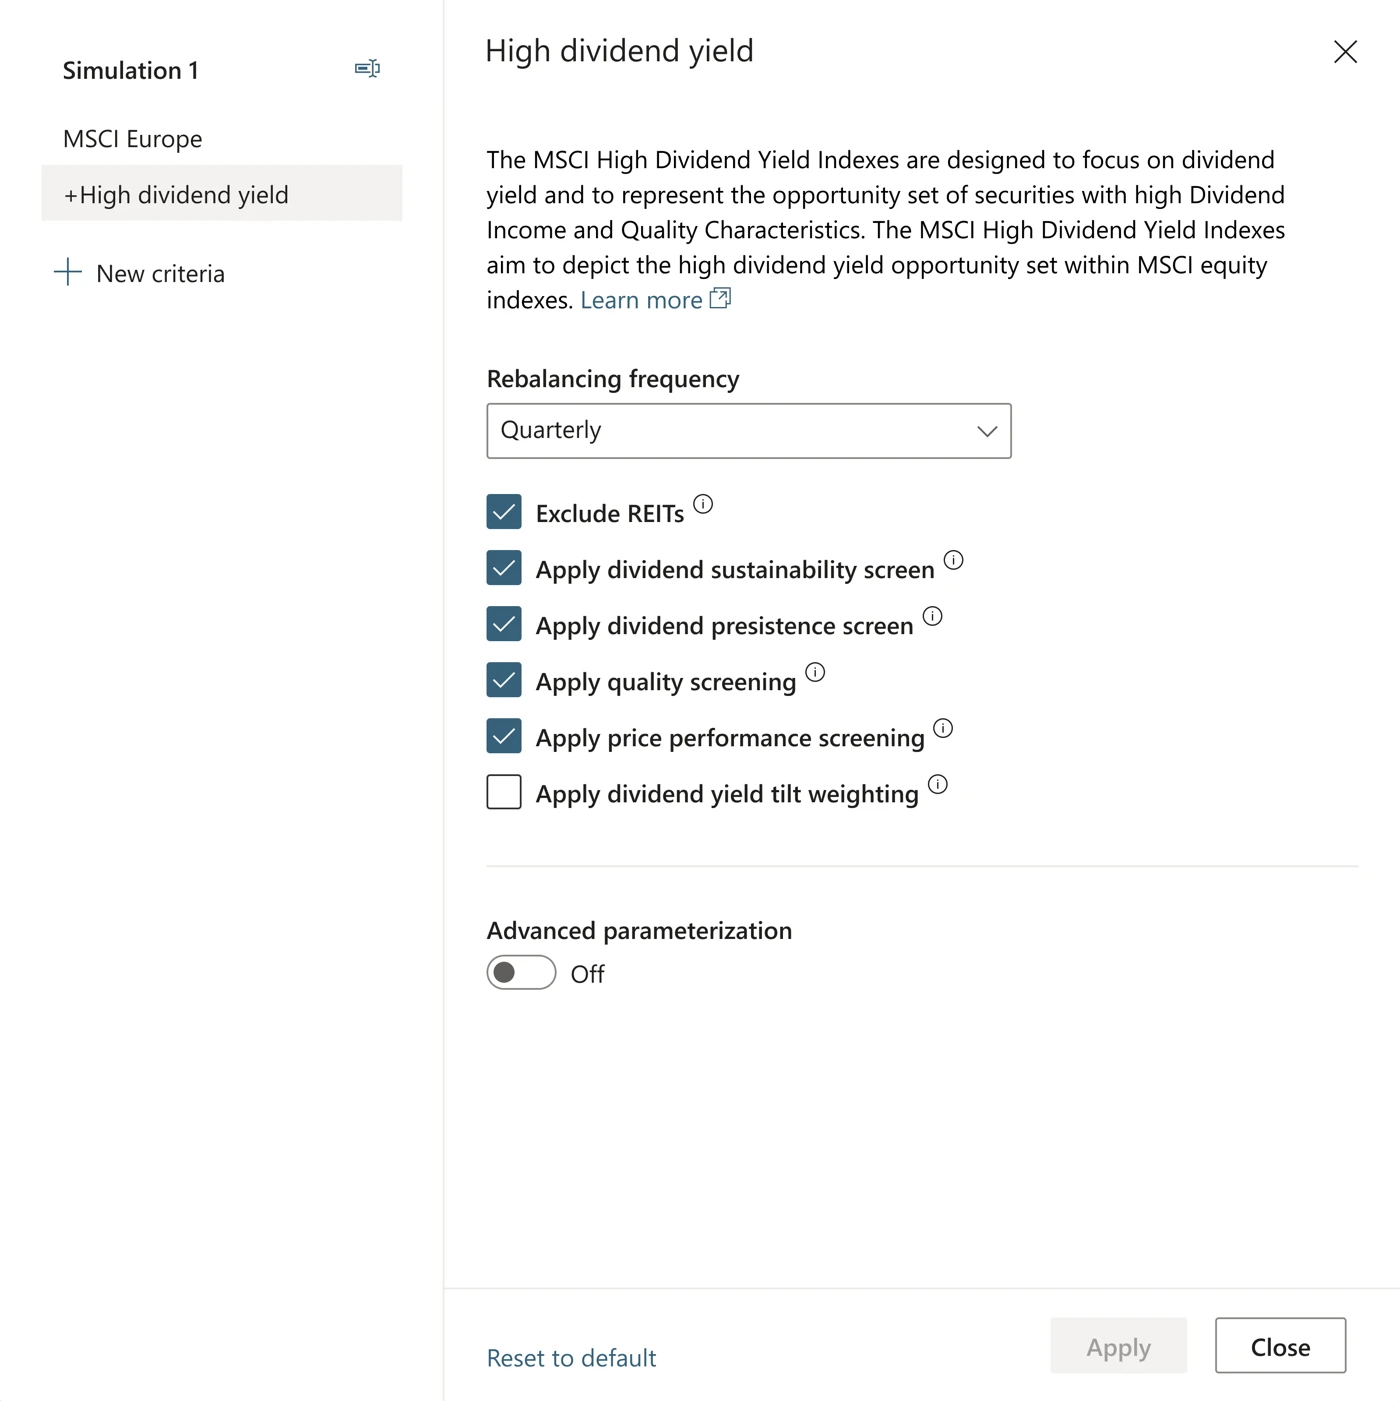
Add criteria dialog with categories for capping, climate, ESG, factor, screening and weighting, listing 10/40, 25/50 and simple capping options High dividend yield settings: rebalancing frequency, screening checkboxes and advanced parameterization
Simulation results: absolute performance chart from 2014 to 2021 for USA, high dividend yield and climate change, with key metrics below and the criteria panel on the right
(02) Backtest

See how it has performed historically

Run the simulation against a benchmark over any date range. Switch between performance views, currencies and variants to see each layer's effect over time.

(03) Compare

Compare numbers side by side

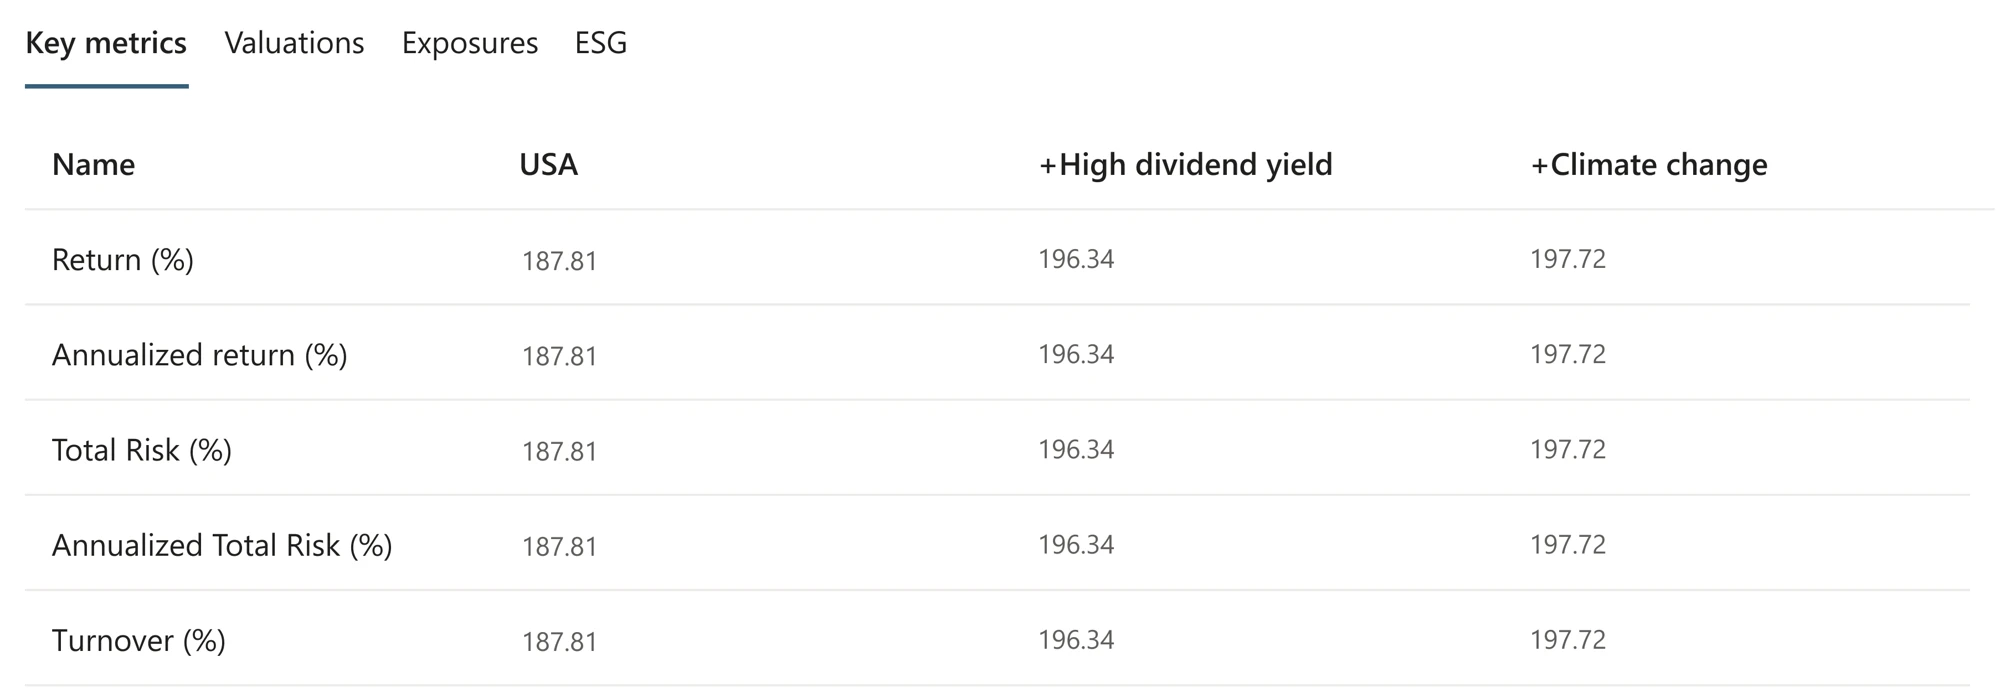
Key metrics like return, total risk and turnover line up in columns for each layer, with valuations, exposures and ESG one tab away.

Key metrics table comparing return, annualized return, total risk, annualized total risk and turnover for each layer

impact

  1. 01Turned index construction into a visual, step-by-step workflow
  2. 02Put backtest results and key metrics in one view
  3. 03Launched in December 2021
This is a lot more trustworthy in a way. It's easier to find what I need.
— Financial asset manager, Index Builder user, NYC