Explore top indexes, curated by MSCI
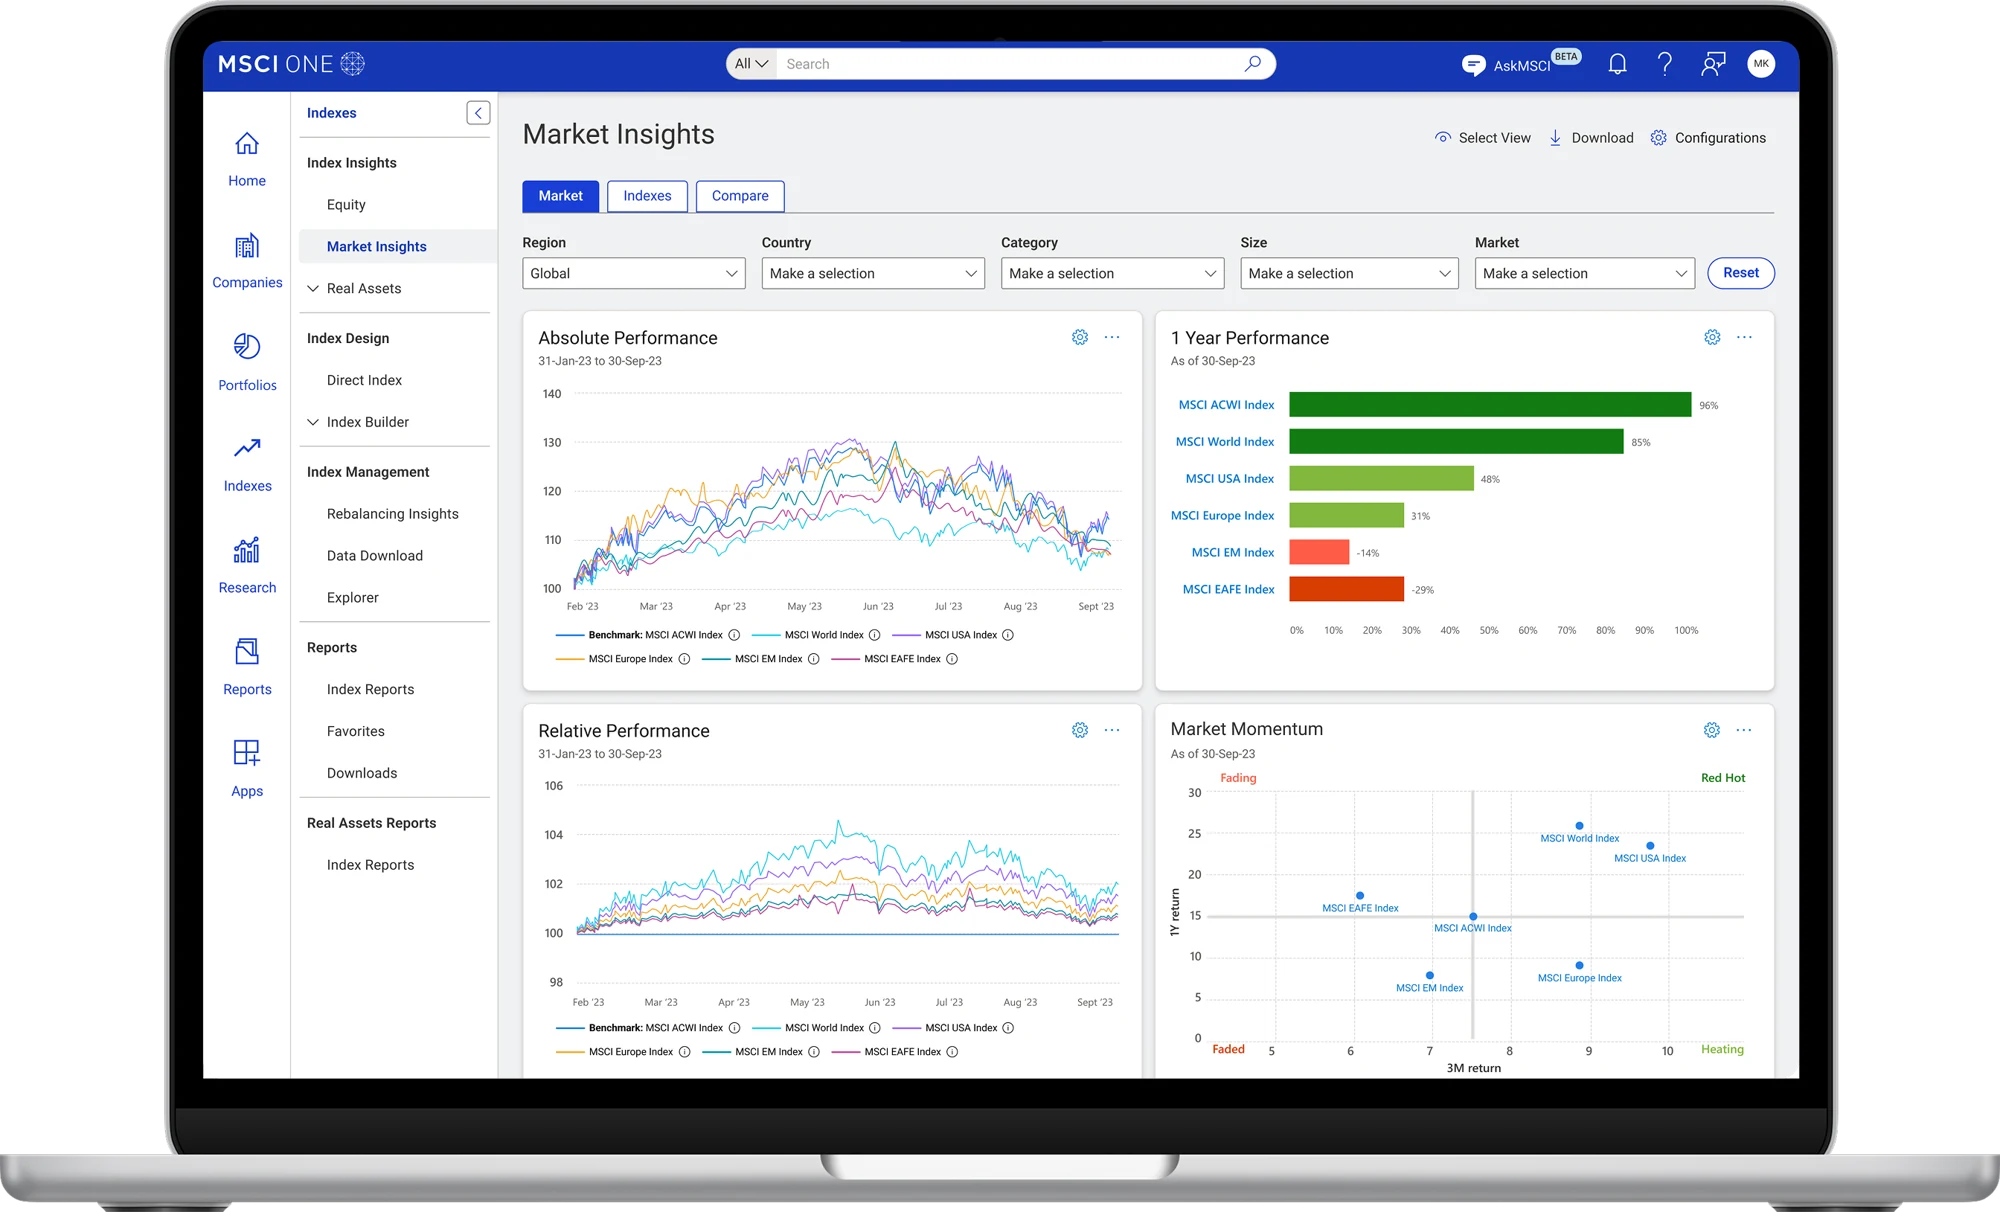
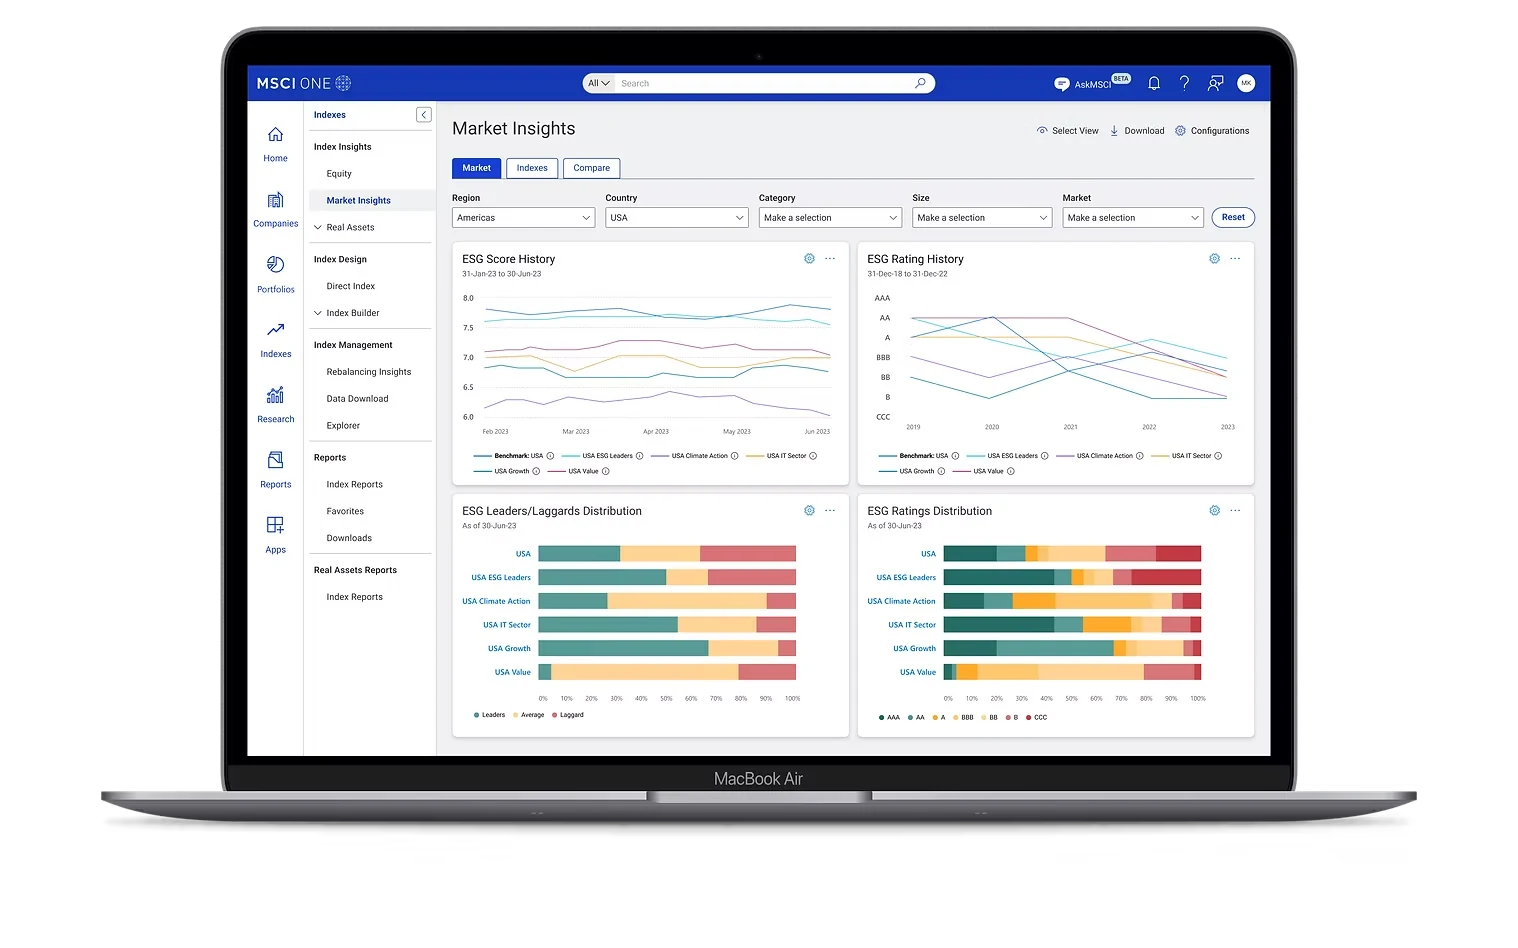
The Market view starts with expert-selected indexes. Filters for region, country, category, size and market mirror how investors already think, so a view like ESG trends across US indexes is a few clicks away.
Helping investment professionals explore and visualize market data to uncover meaningful investment insights.
MSCI has one of the world's most comprehensive index libraries, but access was costly and fragmented. Users downloaded data and analyzed it in their own tools, never seeing the full breadth of what was available.
One place for MSCI's entire index universe, with two ways in: guided exploration for asset owners, and fast, direct access for asset managers.
Unlocked the full index universe in one experience, reduced reliance on third-party platforms, and positioned MSCI as an insight platform, not just a data provider.
From one screen of everything to one system with many ways in.
Interviews with asset owners and asset managers surfaced shared goals — find, compare and evaluate indexes — but slow, repetitive paths to get there.
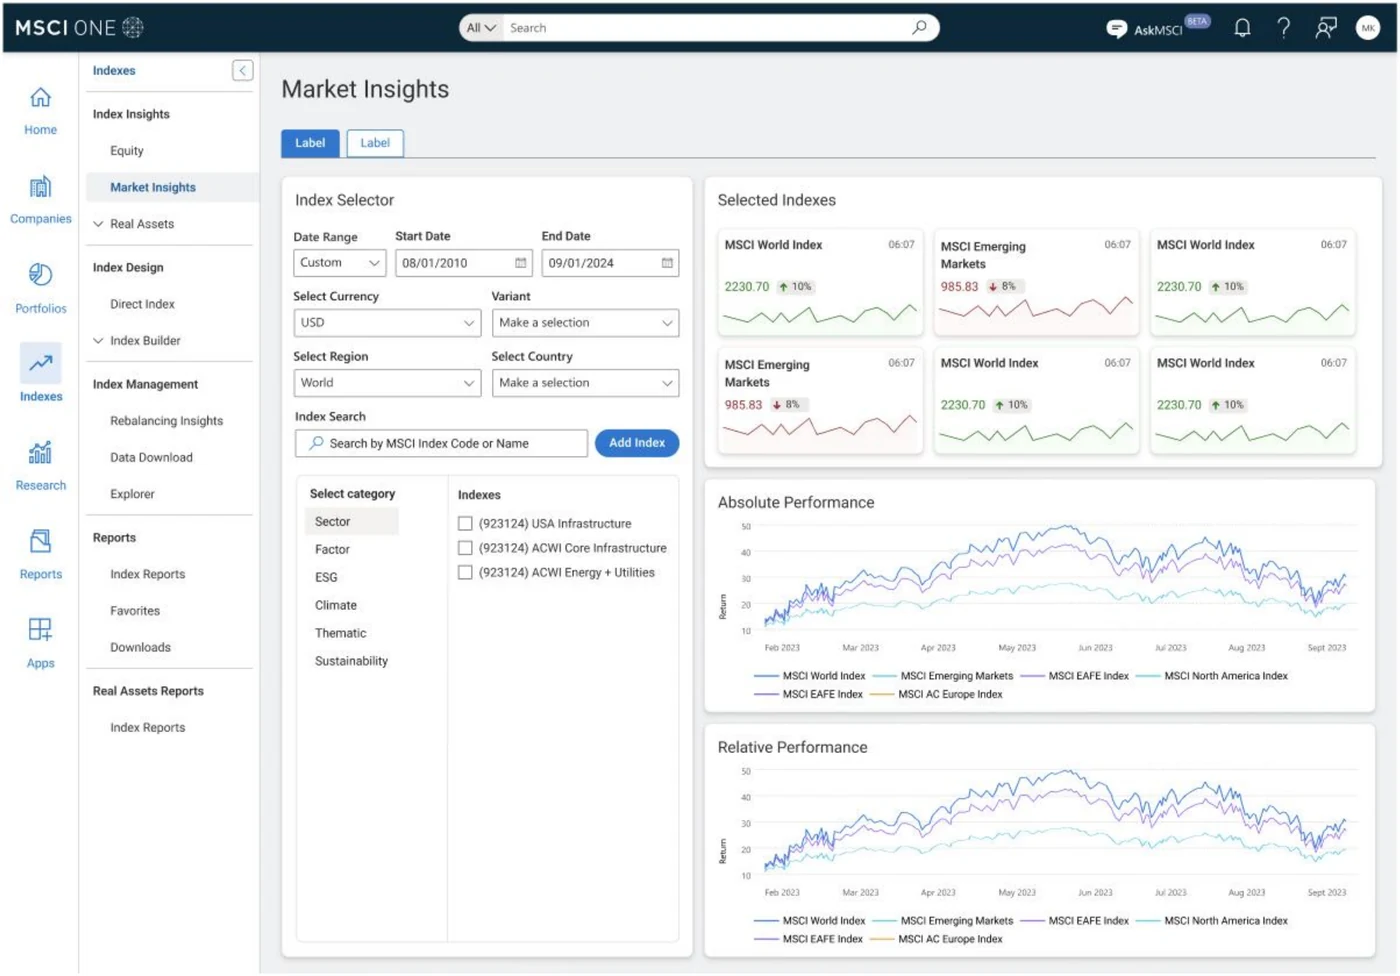
The first concept put everything on one screen. Users told us: “this is the information I want to see — but not how I want to see it.”
A workshop revisiting the research revealed two behaviors: exploratory users who need guidance and context, and goal-oriented users who want speed and direct access.
The data users want is the same. The way they want to reach it is fundamentally different.
One system that supports both exploration and precision, without compromising either.
The Market view starts with expert-selected indexes. Filters for region, country, category, size and market mirror how investors already think, so a view like ESG trends across US indexes is a few clicks away.
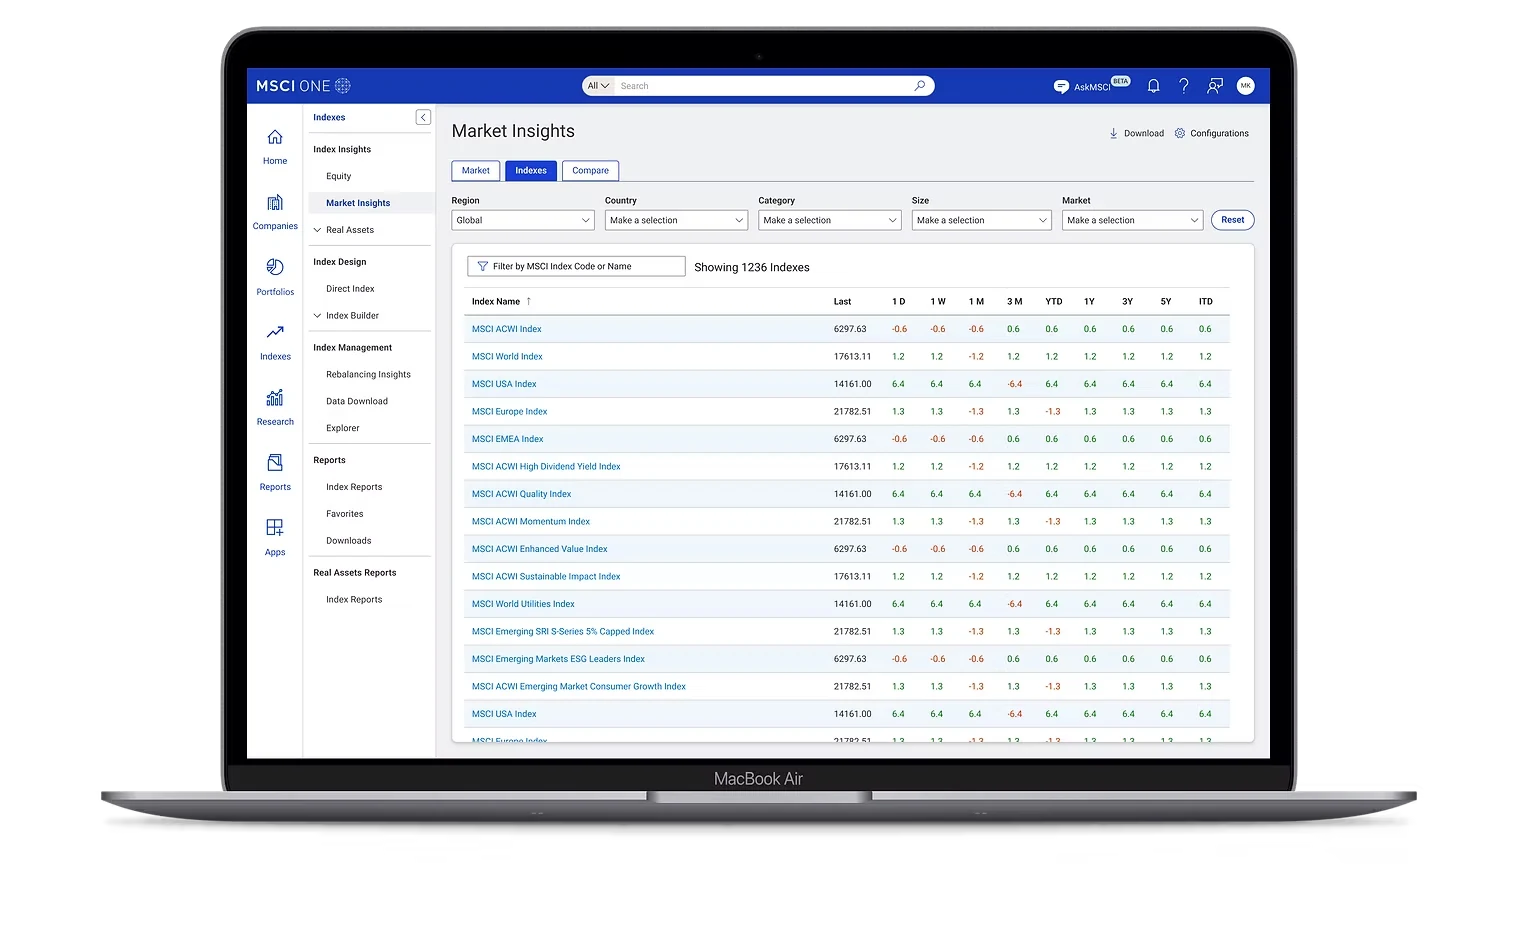
The Indexes tab puts MSCI's library in one searchable table with over 1,200 indexes, filterable by code or name, with returns across time periods at a glance. Users who know what they want get there fast.
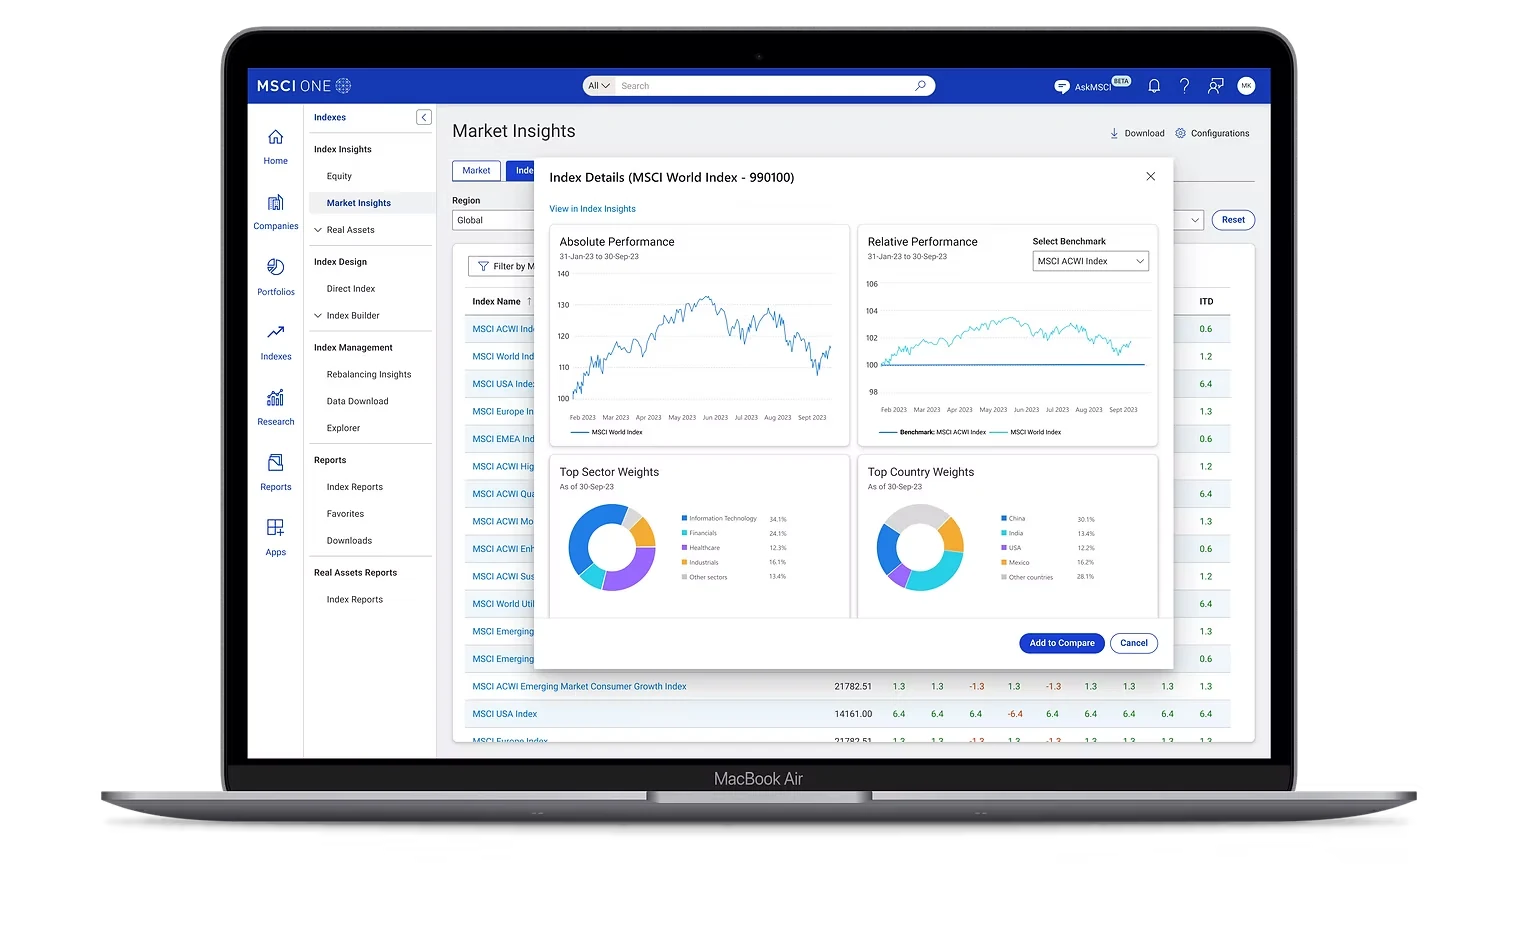
Index details open in place, with absolute and relative performance against a chosen benchmark plus top sector and country weights. One click adds the index to a comparison.
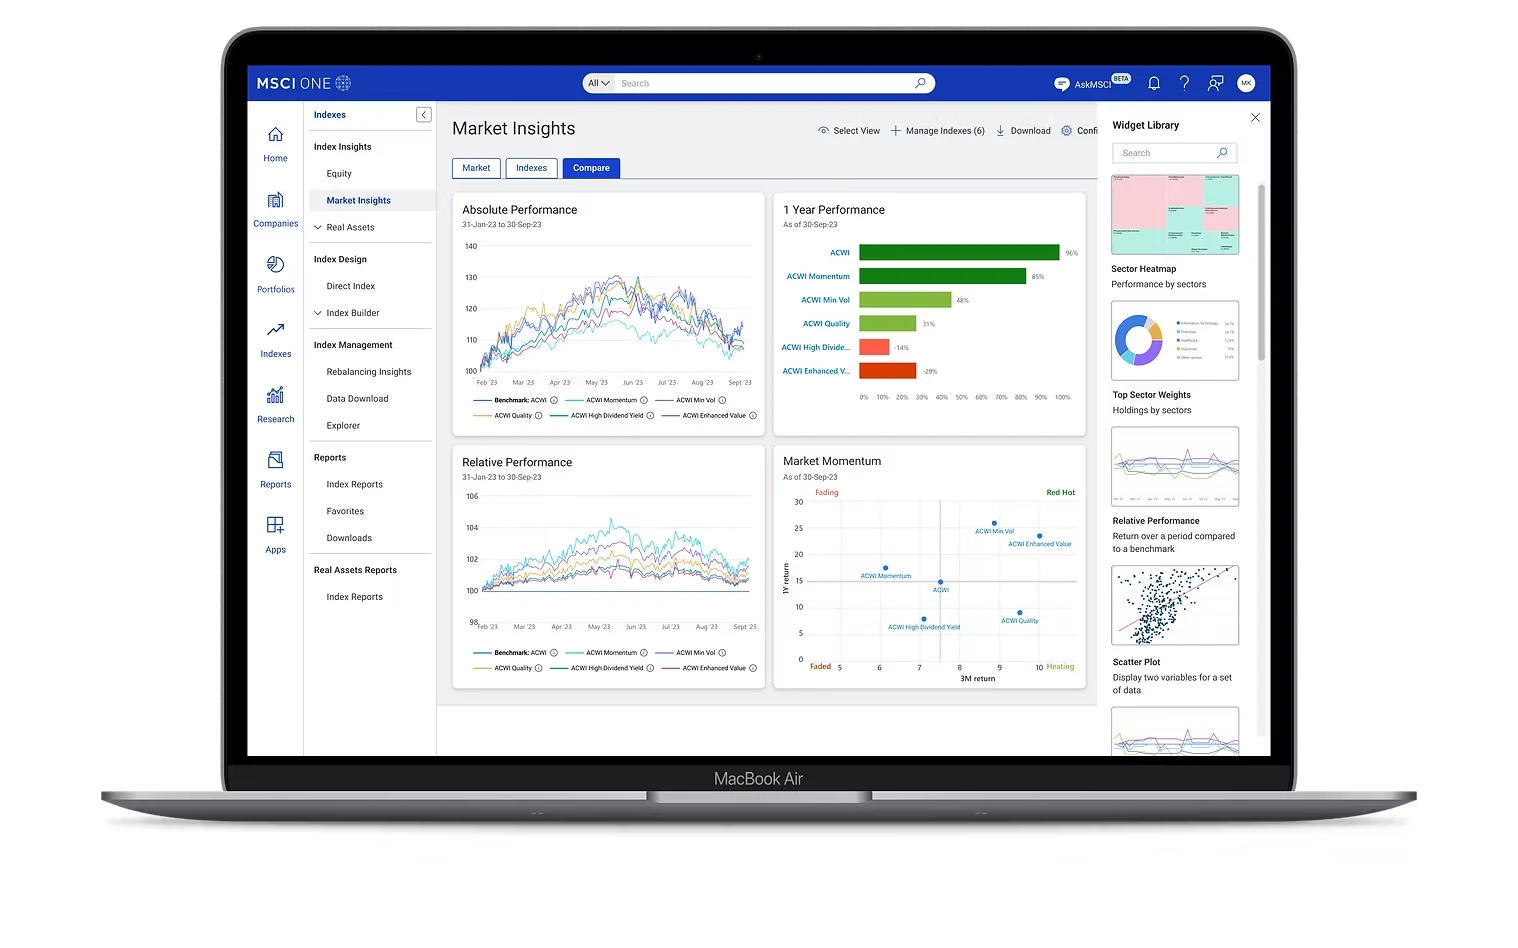
The Compare view allows users to select their own list of curated indexes, and a widget library lets teams add views like sector heatmaps or scatter plots building a dashboard around the question in front of them, or the client across the table.
“Very helpful for presenting to clients, especially when they come to you with open questions.”
A vast majority of our meetings with clients is covering market insights. This is going to be an incredible tool.
(next project)
Strategy Explorer